Back to site
Download
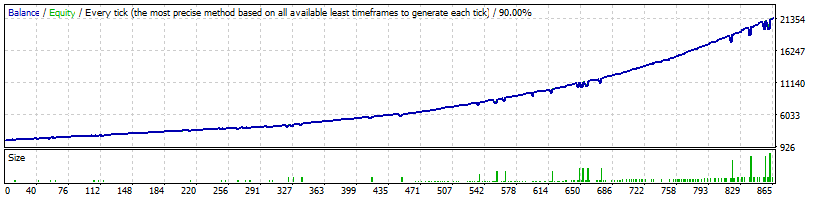
Test On AUDUSD Normal Risk
Strategy Tester Report
FXTrackPRO
EGlobal-Demo (Build 1384)
| Symbol | AUDUSD (Australian Dollar vs US Dollar) | ||||
| Period | 1 Hour (H1) 2017.01.02 00:01 - 2023.07.10 00:00 (2017.01.01 - 2023.07.10) | ||||
| Model | Every tick (the most precise method based on all available least timeframes) | ||||
| Bars in test | 2425728 | Ticks modelled | 23591626 | Modelling quality | 90.00% |
| Mismatched charts errors | 0 | ||||
| Initial deposit | 2000.00 | Spread | 20 | ||
| Total net profit | 19462.88 | Gross profit | 36424.17 | Gross loss | -16961.29 |
| Profit factor | 2.15 | Expected payoff | 22.53 | ||
| Absolute drawdown | 434.02 | Maximal drawdown | 4362.50 (20.74%) | Relative drawdown | 27.07% (1200.90) |
| Total trades | 864 | Short positions (won %) | 427 (53.63%) | Long positions (won %) | 437 (52.86%) |
| Profit trades (% of total) | 460 (53.24%) | Loss trades (% of total) | 404 (46.76%) | ||
| Largest | profit trade | 1588.60 | loss trade | -761.12 | |
| Average | profit trade | 79.18 | loss trade | -41.98 | |
| Maximum | consecutive wins (profit in money) | 9 (192.81) | consecutive losses (loss in money) | 4 (-1346.11) | |
| Maximal | consecutive profit (count of wins) | 1588.60 (1) | consecutive loss (count of losses) | -1346.11 (4) | |
| Average | consecutive wins | 2 | consecutive losses | 2 | |
Download